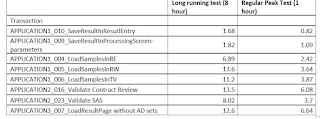
I would like to share another interesting Database issue
I could figure out that the
issue was with the Database. If you see the
below snapshot from AppDynamics, Resource semaphore wait stats in sql server had increased during the middle of the load test.
I had gathered few additional statistics from Grafana to
understand the root cause and found that the applications slowed down and
server memory reached its limit (84 GB )and resource semaphore events were
getting triggered as shown in the image below
Next step is to determine which query is causing the issue.
So I ran DMV in SQL server to determine the same.
DB_NAME(der.database_id) AS database_name ,
deqp.query_plan ,
SUBSTRING(dest.text, der.statement_start_offset / 2,
( CASE WHEN der.statement_end_offset = -1
THEN DATALENGTH(dest.text)
ELSE der.statement_end_offset
END - der.statement_start_offset ) / 2)
AS [statement executing] ,
der.cpu_time
--der.granted_query_memory
--der.wait_time
--der.total_elapsed_time
--der.reads
FROM sys.dm_exec_requests
der
INNER
JOIN sys.dm_exec_sessions
des
ON des.session_id = der.session_id
CROSS
APPLY sys.dm_exec_sql_text(der.sql_handle) dest
CROSS
APPLY sys.dm_exec_query_plan(der.plan_handle) deqp
WHERE des.is_user_process = 1
AND der.session_id <> @@spid
ORDER BY der.cpu_time DESC ;
-- ORDER
BY der.granted_query_memory DESC ;
-- ORDER
BY der.wait_time DESC;
-- ORDER
BY der.total_elapsed_time DESC;
-- ORDER
BY der.reads DESC;
Note: The amount of the workspace memory for a query is called a memory grant. A memory grant is calculated during the query compilation and then, when the execution should start, this amount is requested and, depending on the available memory, granted to a query.
Solution : Tune the sql query to reduce memory usag. Development team had given the fix in a day and that solved the problem


