Showing posts with label performance. Show all posts

Saturday, November 6, 2021

Slowness in long running load tests

 I would like to share another interesting Database issue

 Performance Testing team had shared the below report where they had observed slowness in long running test after 1.5 hours, which they don’t notice in shorter tests for an hour long


I could figure out that the issue was with  the Database.  If you see the below snapshot from AppDynamics, Resource semaphore wait stats in sql server had increased during the middle of the load test.


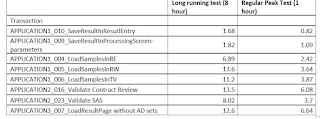
I had gathered few additional statistics from Grafana to understand the root cause and found that the applications slowed down and server memory reached its limit (84 GB )and resource semaphore events were getting triggered as shown in the image below


Next step is to determine which query is causing the issue. So I ran DMV in SQL server to determine the same.

 SELECT der.session_id ,

DB_NAME(der.database_id) AS database_name ,

deqp.query_plan ,

SUBSTRING(dest.text, der.statement_start_offset / 2,

( CASE WHEN der.statement_end_offset = -1

THEN DATALENGTH(dest.text)

ELSE der.statement_end_offset

END - der.statement_start_offset ) / 2)

AS [statement executing] ,

der.cpu_time

--der.granted_query_memory

--der.wait_time

--der.total_elapsed_time

--der.reads

FROM sys.dm_exec_requests der

INNER JOIN sys.dm_exec_sessions des

ON des.session_id = der.session_id

CROSS APPLY sys.dm_exec_sql_text(der.sql_handle) dest

CROSS APPLY sys.dm_exec_query_plan(der.plan_handle) deqp

WHERE des.is_user_process = 1

AND der.session_id <> @@spid

ORDER BY der.cpu_time DESC ;

-- ORDER BY der.granted_query_memory DESC ;

-- ORDER BY der.wait_time DESC;

-- ORDER BY der.total_elapsed_time DESC;

-- ORDER BY der.reads DESC;


 Output of the DMV gave us the Culprit. it  is a query requesting around 16GB of Server memory (memory grant) for execution. This query needs server memory to store temporary data while sorting and joining rows.

Note:  The amount of the workspace memory for a query is called a memory grant. A memory grant is calculated during the query compilation and then, when the execution should start, this amount is requested and, depending on the available memory, granted to a query.

Solution : Tune the sql query to reduce memory usag. Development team had given the fix in  a day and that solved the problem


Tuesday, October 26, 2021

Antivirus software and performance impact

Sometime back, I received a request  about Appdynamics not fetching data in windows server 2016  but it works fine in other operating systems. To give you a background, Appdynamics fetches data via WMI scripts, which inturn obtain data from perfmon counters in regular time intervals.

I was presented with the following metrics for WMI scritps(written in VB) used by appdynamics and clearly shows windows 2016 is slower. 


Appdynamics vendor provided proof that it works in other companies where same OS was hosted.  

So the challange is to debug in our environment, I took an approach to trace all the system calls using procmon to determine the rootcause.


Root cause of this WMI script slowness in 2016 is due to MacAfee interfering with the process. If you see the snapshot above, McAfee took 352 sec which attributes to 90% of the total time. The same behavior is not found in 2012 version.

Mcafee accepted the issue and gave us a patch which resolved the problem. 

Debugging is always fun :)


Claim Based Authorization

  1.      Claim Based Authorization ·         Token Validation: As requests come into the Ocelot API Gateway, the first step is to validat...