Saturday, October 1, 2022

Azure Cost Optimization - Tips

 It is very important to have tight control of the cost and manage it efficiently.  Cloud Computing has two major tasks. i.e. Store Data and execute code. Networking is an essential element used to tie systems together and implement security.

 Below are some of the tips that can help teams who are looking to optimize costs.

Compute Charges

Compute services are those that take your code and execute it in the cloud. There are several compute resources (around 20) in azure. All these services have virtual machines as their core. Examples are AKS, VMSS, etc


 Storage Charges


Type

Description

Key points

Factors impact storage cost

Unmanaged Storage

It relies on the user to monitor and react to the accounts
Blobs, Files, Table Data, Queue messages

The storage account has a maximum capacity.  5 PiB

GB's Used

It has Operations per second limit

IO Operations

Violations will get errors but the advantage is paid for what you use

Region

Nothing will be changed if no data is in a storage account

Redundancy

Unmanaged storage is extremely cheap

Access tier(Premium, hot, cool, Archive)

Managed Storage


Managed disks. Used by VM's

premium disks are very expensive


e.g.: HDD, (Sold  Premium, Ultra) SSD


Guidelines and recommendations for optimizing storage cost.

Total Storage cost covers the cost to store data and the cost to perform file operations

Costs to store files

Cost to perform File Operations(listing, writing, reading on storage accounts)

Are you storing log files for many months that you may not need?

If you expecting millions of reads and writes per month, it might be cheaper to use a premium storage tier that hot one

Are you storing memory dumps?

Premium storage is used more for storage and less for access. Recommended

·        Production load Premium disks,

·        Standard disks - for QA/Dev

Are you storing System backups from years/months ago with no regulatory reasons to keep them

if a file is placed in the cool tier, it will be charged for a min of 30 days even if you delete before then

if you delete VM, ensure deleting associated DISK


Sometimes, People enable read access geo-redundant storage which is 3 or 4 times of local redundant storage.
Do you use a secondary endpoint for read purposes? If they just wanted in a different region, then why not use GRS instead of RAGRS?


Premium charges most for storage but charges less for reading, if storage performance is a primary concern then select premium, if this file is not used frequently then it should move to the cool tier. If you don't need that file, you can reduce costs further by moving to the archive

Redundancy impacts costs - LRS is cheap and RA-GRS is expensive.
Reserve storage if you use more than 100 TB of data and save 30% of the cost


Other Services


App Service

Are you creating different appservice plan for multiple webapps


Creating different app service plans may not be needed. Create it only when there is capacity requirements

AKS


Dev, Test, and non-business hrs. reduce to zero instance cluster

Networking

single app gateway can host multiple applications

same with respect to WAF

Media Services

streaming can be standard and premium

98% of workload standard is fine, encoding can be done  2 ways

App Insights

data ingestion

90 days is free, enables data sampling(50%/75%), Keep  a daily cap on data

Log Analytics


Leverage Reserve capacity for data ingestion


Sunday, September 25, 2022

Application DAST - Tool Evaluation

Dynamic Application Security Testing (DAST) is a procedure that actively investigates running applications with penetration tests to detect possible security vulnerabilities. 

To address this growing security threat, businesses are increasingly deploying dynamic application security testing (DAST) tools as part of a more security-forward approach to web application development. DAST tools provide insight into how your web applications behave while they are in production, enabling your business to address potential vulnerabilities before a hacker uses them to stage an attack. As your web applications evolve, DAST solutions continue to scan them so that your business can promptly identify and remediate emerging issues before they develop into serious risks.

we have evaluated a few tools in 2021 against open source vulnerable applications to determine a tool that can be integrated with release pipelines and can be seamlessly integrated into SDLC.

These commercial tools could identify a very tiny subset of known vulnerabilities. It cannot replace manual pen testing but can complement pen testers.    The below tables provide a high-level evaluation summary of the tools shortlisted


Vulnerabilities detected by these tools 


Saturday, November 6, 2021

Slowness in long running load tests

 I would like to share another interesting Database issue

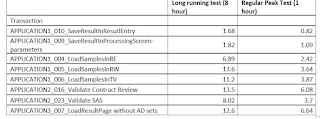
 Performance Testing team had shared the below report where they had observed slowness in long running test after 1.5 hours, which they don’t notice in shorter tests for an hour long


I could figure out that the issue was with  the Database.  If you see the below snapshot from AppDynamics, Resource semaphore wait stats in sql server had increased during the middle of the load test.


I had gathered few additional statistics from Grafana to understand the root cause and found that the applications slowed down and server memory reached its limit (84 GB )and resource semaphore events were getting triggered as shown in the image below


Next step is to determine which query is causing the issue. So I ran DMV in SQL server to determine the same.

 SELECT der.session_id ,

DB_NAME(der.database_id) AS database_name ,

deqp.query_plan ,

SUBSTRING(dest.text, der.statement_start_offset / 2,

( CASE WHEN der.statement_end_offset = -1

THEN DATALENGTH(dest.text)

ELSE der.statement_end_offset

END - der.statement_start_offset ) / 2)

AS [statement executing] ,

der.cpu_time

--der.granted_query_memory

--der.wait_time

--der.total_elapsed_time

--der.reads

FROM sys.dm_exec_requests der

INNER JOIN sys.dm_exec_sessions des

ON des.session_id = der.session_id

CROSS APPLY sys.dm_exec_sql_text(der.sql_handle) dest

CROSS APPLY sys.dm_exec_query_plan(der.plan_handle) deqp

WHERE des.is_user_process = 1

AND der.session_id <> @@spid

ORDER BY der.cpu_time DESC ;

-- ORDER BY der.granted_query_memory DESC ;

-- ORDER BY der.wait_time DESC;

-- ORDER BY der.total_elapsed_time DESC;

-- ORDER BY der.reads DESC;


 Output of the DMV gave us the Culprit. it  is a query requesting around 16GB of Server memory (memory grant) for execution. This query needs server memory to store temporary data while sorting and joining rows.

Note:  The amount of the workspace memory for a query is called a memory grant. A memory grant is calculated during the query compilation and then, when the execution should start, this amount is requested and, depending on the available memory, granted to a query.

Solution : Tune the sql query to reduce memory usag. Development team had given the fix in  a day and that solved the problem


Tuesday, October 26, 2021

Antivirus software and performance impact

Sometime back, I received a request  about Appdynamics not fetching data in windows server 2016  but it works fine in other operating systems. To give you a background, Appdynamics fetches data via WMI scripts, which inturn obtain data from perfmon counters in regular time intervals.

I was presented with the following metrics for WMI scritps(written in VB) used by appdynamics and clearly shows windows 2016 is slower. 


Appdynamics vendor provided proof that it works in other companies where same OS was hosted.  

So the challange is to debug in our environment, I took an approach to trace all the system calls using procmon to determine the rootcause.


Root cause of this WMI script slowness in 2016 is due to MacAfee interfering with the process. If you see the snapshot above, McAfee took 352 sec which attributes to 90% of the total time. The same behavior is not found in 2012 version.

Mcafee accepted the issue and gave us a patch which resolved the problem. 

Debugging is always fun :)


Tuesday, October 19, 2021

IIS Application app pool getting crashed intermittently

I was debugging another interesting issue  where after doing a specific business transaction, Application pool getting stopped and service become unavailable.

Application logs doesn’t give much details

2021-10-08 19:48:25.8085 4.10.191 INFO Beginning Startup...

2021-10-08 19:48:25.8505 4.10.191 INFO CORS configuration found, allowing the following Origins: 

2021-10-08 19:48:25.8505 4.10.191 INFO Allowed Origin: https://xxx.hostname..local

2021-10-08 19:48:25.8505 4.10.191 INFO Applying CORS Configurations

2021-10-08 19:48:25.8505 4.10.191 WARN `Auth Configuration not found, defaulting to IWA

2021-10-08 19:48:25.8505 4.10.191 INFO Configuring for Intergrated Windows Authentication

2021-10-08 19:48:28.0246 4.10.191 INFO Authorization.Extension: Start parsing : "D:\inetpub\wwwroot \1.0\bin\Authorization.rules".

2021-10-08 19:48:28.1396 4.10.191 INFO Authorization Role Definitions have been created.

2021-10-08 19:48:28.1396 4.10.191 INFO Authorization.Extension: Successfully finished parsing : "D:\inetpub\wwwroot\1.0\bin\Authorization.rules".

2021-10-08 19:48:31.2079 4.10.191 INFO Startup Completed.

Another Http exception was also observed as below 

Message: Request is not available in this context
Stack:
[HelperMethodFrame]
System.Web.HttpContext.get_Request()
System.Web.HttpContextWrapper.get_Request()
NLog.Web.Internal.HttpContextExtensions.TryGetRequest(System.Web.HttpContextBase)
NLog.Web.LayoutRenderers.AspNetRequestValueLayoutRenderer.DoAppend(System.Text.StringBuilder, NLog.LogEventInfo)
NLog.LayoutRenderers.LayoutRenderer.RenderAppendBuilder(NLog.LogEventInfo, System.Text.StringBuilder)
NLog.Layouts.SimpleLayout.RenderAllRenderers(NLog.LogEventInfo, System.Text.StringBuilder)
NLog.Layouts.Layout.RenderAppendBuilder(NLog.LogEventInfo, System.Text.StringBuilder, Boolean)
NLog.Layouts.SimpleLayout.PrecalculateBuilder(NLog.LogEventInfo, System.Text.StringBuilder)
NLog.Targets.Target.PrecalculateVolatileLayoutsConcurrent(NLog.LogEventInfo)
NLog.Targets.Wrappers.AsyncTargetWrapper.Write(NLog.Common.AsyncLogEventInfo)
NLog.Targets.Wrappers.AsyncTargetWrapper.WriteAsyncThreadSafe(NLog.Common.AsyncLogEventInfo)
NLog.Targets.Target.WriteAsyncLogEvent(NLog.Common.AsyncLogEventInfo)
NLog.LoggerImpl.WriteToTargetWithFilterChain(NLog.Targets.Target, NLog.Filters.FilterResult, NLog.LogEventInfo, NLog.Common.AsyncContinuation)
NLog.LoggerImpl.Write(System.Type, NLog.Internal.TargetWithFilterChain, NLog.LogEventInfo, NLog.LogFactory)
NLog.Logger.Trace(System.String)
System.Web.HttpApplication.InitModulesCommon()
System.Web.HttpApplication.InitInternal(System.Web.HttpContext, System.Web.HttpApplicationState, System.Reflection.MethodInfo[])
System.Web.HttpApplicationFactory.GetNormalApplicationInstance(System.Web.HttpContext)
System.Web.HttpRuntime.ProcessRequestNotificationPrivate(System.Web.Hosting.IIS7WorkerRequest, System.Web.HttpContext)
System.Web.Hosting.PipelineRuntime.ProcessRequestNotificationHelper(IntPtr, IntPtr, IntPtr, Int32)
System.Web.Hosting.PipelineRuntime.ProcessRequestNotification(IntPtr, IntPtr, IntPtr, Int32)
DomainNeutralILStubClass.IL_STUB_ReversePInvoke(Int64, Int64, Int64, Int32)


Events logs

Events logs has below entries and it doesn’t have stack trace to debug

  •         A process serving application pool name.Psh' suffered a fatal communication error with the Windows Process Activation Service. The process id was '53196'. The data field contains the error number.
  •        Application pool name.Psh ' is being automatically disabled due to a series of failures in the process(es) serving that application pool.
  •         Application popup: w3wp.exe - System Error : A new guard page for the stack cannot be created.


To debug, I have configured debugdiag to capture memory dumps on crash and found couple of exceptions on the threads

  45   60 1ef18 00000214ce10fff0  1029220 Preemptive  0000000000000000:0000000000000000 00000214af874010 0     Ukn (Threadpool Worker)

  46   62 7884 00000214cdf937a0  1029220 Cooperative 00000214B811CB00:00000214B811D8D0 00000214af95f900 0     Ukn (Threadpool Worker)

  47   47 8b50 00000214ce0f28c0  8029220 Preemptive  0000000000000000:0000000000000000 00000214af874010 0     Ukn (Threadpool Completion Port)

  48   65 17114 00000214ce10a1f0  8029220 Preemptive  0000000000000000:0000000000000000 00000214af874010 0     Ukn (Threadpool Completion Port)

  49   63 7bd4 00000214cdbafd90  1029220 Preemptive  0000000000000000:0000000000000000 00000214af874010 0     Ukn (Threadpool Worker)

  50   61 1598 00000214ce0ab520  1029220 Preemptive  0000000000000000:0000000000000000 00000214af874010 0     Ukn (Threadpool Worker)

  51   58 16c04 00000214ce0f20f0  1029220 Preemptive  0000000000000000:0000000000000000 00000214af874010 0     Ukn (Threadpool Worker)

  52   57 1314c 00000214cdfaf0e0  1029220 Preemptive  0000000000000000:0000000000000000 00000214af874010 0     Ukn (Threadpool Worker)

  53   55 1ecfc 00000214cdfad060  1029220 Preemptive  0000000000000000:0000000000000000 00000214af874010 0     Ukn (Threadpool Worker)

  54   54 12004 00000214ce10c130  1029220 Preemptive  0000000000000000:0000000000000000 00000214af874010 0     Ukn (Threadpool Worker)

  55   53 128f0 00000214ce0f3860  1029220 Preemptive  00000214B811A580:00000214B811B8D0 00000214af95f900 0     Ukn (Threadpool Worker) System.Web.HttpException 00000214b811a498

  56   52 c7a0 00000214ce0fa0d0  1029220 Preemptive  00000214B80E8168:00000214B80E98D0 00000214af95f900 1     Ukn (Threadpool Worker) System.StackOverflowException 00000214afc91158

  57   48 e110 00000214ce0c0950  1029220 Preemptive  0000000000000000:0000000000000000 00000214af874010 0     Ukn (Threadpool Worker)

  58   34 7a4c 00000214ce0f0980  1029220 Preemptive  0000000000000000:0000000000000000 00000214af874010 0     Ukn (Threadpool Worker)

  59   39 3450 00000214ce0f1150  1029220 Preemptive  0000000000000000:0000000000000000 00000214af874010 0     Ukn (Threadpool Worker)


from the dump, Its clear that app pool crashed due to System.StackOverflowException on thread 56


Review the stack trace of thread 56 gives hint that automapper causing stack overflow


RootCause

Application has circular reference in its classes which are used on the workflow because of this when user attempt to perform type casting via automapper, stack is getting filled up.

Solution to the problem is to Avoid type conversion via auto mapper instead converting types using manual mapping.


Tuesday, October 12, 2021

Fiddler improves Service Response times?

One of the development teams approached me with an interesting issue. The issue description states the response time of a service call is faster by 100% when ever Fiddler is running.  I was requested to suggest if the same performance can be achieved without fiddler.

I took some Network traces  at the client with and with out fiddler and found some interesting observations

Without fiddler, Only 2 TCP connections were used between the client and the server


With Fiddler - there were 4 active parallel TCP connections resulting  faster response time


With the data it is clear more the parallel connections the better the response time. With the issue identified solution is even simpler

By default, we can create only two simultaneous connections to an HTTP server.   This can be increased to avoid a backlog of requests during times of very high transaction volume. It can be done in many ways as given in the link below

https://developer.cybersource.com/library/documentation/dev_guides/Simple_Order_API_Clients/html/Topics/Setting_the_Connection_Limit.htm


Monday, September 20, 2021

Dynamic Compression in IIS

 Dynamic compression doesn't work by default in IIS and there are few config changes that are needed to be done for it to working. Please refer the below steps to implement the same

Enable Compression in IIS application

 Prerequisite: Dynamic content compression module should be installed. If it is not installed, please install. It can be done using Server Manager.

Do the followings for Webclient and other sites related to the application.

·       Enable Dynamic Compression at site level.


·       Traverse Configuration Editor to check and configure appropriate compression settings.


·       Traverse to “system.webServer/httpCompression” section.


·      
Click on dynamic Types and add application/json mimeType if missing. That is responsible to compress api level responses. Add this in Webclient and API site levels.


·       Save and restart the app pool.

·       Verify in the client side that dynamic compression is working or not. It should have “Content-Encoding: gzip” in Response Headers.


Why Late-Stage Release Scope Control Fails (And How to Fix It)

  Why Late-Stage Release Scope Control Fails (And How to Fix It) Enforcing strict scope control right before a major release often backfires...